Friday, December 28, 2012

Data Discovery and Analysis in Hays County, TX

Locations of streamflow data in Hays County, Texas including Jacob's Well Spring and the Blanco River.
A comprehensive HydroDesktop data discovery and analysis exercise has been added to the HydroDesktop User Guide: Data Discovery and Analysis: The Hydrology of Jacob's Well Spring. This tutorial covers all the basics in HydroDesktop while examining the hydrology of Jacob's Well Spring and the Blanco River (Hays County, Texas); how to search for data in multiple ways, how to download data, how to visualize downloaded data, and how to export downloaded data. Additionally, this exercise includes an advanced section that utilizes the HydroR plugin to analyze mixing of surface and subsurface water sources.

Happy Holidays and Happy New Year!


Thursday, December 20, 2012

The HydroDesktop User Guide


As we prepare to release a new recommended version of HydroDesktop*, we have also been updating the User Guide, which is now available on this site. This User Guide contains six pages:

  • User Guide Homepage - Contains information regarding distribution, copyright, and support in addition to a brief introduction of general concepts employed in HydroDesktop.
  • Working with the Map - Contains information regarding navigation of the map in HydroDesktop.
  • Searching for Data - Contains information about searching for data registered in the CUAHSI HIS.
  • Working with Data - Contains information related to viewing and analyzing data in the HydroDesktop environment in addition to exporting the data to external file formats. 
  • HydroR Plugin - Contains information describing the HydroR plugin for statistical analyses.
  • Tutorials - Contains brief tutorials for searching for, downloading, and analyzing data in HydroDesktop.

In addition to the links above, the User Guide is also accessible via links on the top navigation bar and the side navigation bar of this website.

Stay tuned for the official release of the new version of HydroDesktop for 2013!


*If you'd like to preview the next version of HydroDesktop, download the latest experimental version here.


Friday, December 14, 2012

Spotlight On: Ipswich River Watershed Association

The Ipswich River watershed connects 21 Massachusetts communities. Image from IRWA.

The Ipswich River is located in Northeastern Massachusetts. With 45 miles of a meandering path from its source to the sea, the watershed of this river includes at least a part of 21 Massachusetts communities. Since 1997, volunteers from the Ipswich River Watershed Association's (IRWA) Riverwatch Program have collected data to record the conditions of the river.

The IRWA began publishing its data from the Riverwatch Program in HIS earlier this year in order to make the data more publicly accessible. This web service is unlike many of the web services registered with HIS Central because it is a citizens' group rather than academic researchers or a government agency that is publishing data. The variables being observed in this case are water temperature and dissolved oxygen.

There are 34 sites with observations along the Ipswich River in the IRWA web service, which can be seen in this screenshot from HydroDesktop.

The two aforementioned variables (water temperature and dissolved oxygen) are measured at 34 different sites along the Ipswich River, which can be seen in the above screenshot from HydroDesktop. The darkened polygon is the coverage of the Ipswich River watershed as delineated using the EPA Watershed Delineation Tool.

The IRWA web service is an excellent example of how HIS can enable data publication from a variety of sources. These sources are often government agencies or academic researchers, but examples such as the IRWA contribute to HIS being in a unique position as a one stop portal for water data.

For more on the Ipswich River, visit the IRWA website.


Thursday, November 29, 2012

Visit the CUAHSI Booth at AGU!


If you are attending next week's American Geophysical Union Fall Meeting, be sure to stop by the CUAHSI booth (Booth #105 on NSF Street) and say hi! We will be discussing CUAHSI's activities in the water research community, showing HydroDesktop and HIS related demos, and giving away CUAHSI gear!

Need some suggestions for sessions to attend? Check out the list below for sessions that involve HIS.

Monday, 12/3/2012

Session: IN11F. Open Source Technologies and Architectures Facilitating Science Data Center Collaboration and Management II. 8:00 AM - 10:00 AM; 2020 (Moscone West)
 8:30 AM - 8:45 AM. Combining data from multiple sources using the CUAHSI Hydrologic Information System.
David G. Tarboton; Daniel P. Ames; Jeffery S. Horsburgh; Jonathan L. Goodall

Session: GC12B. Sustainable Future: Climate, Resources, and Development I. 10:20 AM - 12:20 PM; 3001 (Moscone West)
11:00 AM. Sharing Water Data to Encourage Sustainable Choices in Areas of the Marcellus Shale.
Susan L. Brantley; Jorge D. Abad; Julie Vastine; David Yoxtheimer; Candie Wilderman; Radisav Vidic; Richard P. Hooper; Kathy Brasier

Thursday, 12/6/2012

Session: ED41A. Distributing Science Data for Reuse Posters. 8:00 AM - 12:20 PM; Hall A-C (Moscone South)
The CUAHSI Water Data Center: Empowering scientists to discover, use, store, and share water data
Alva L. Couch; Richard P. Hooper; Jennifer S. Arrigo

Friday, 12/7/2012

Session: IN53D. Semantics and Cyberinfrastructures for Next Generation Science II. 1:40 PM - 3:40 PM; 2020 (Moscone West)
1:40 PM. Providing Data Access for Interdisciplinary Research.
Richard P. Hooper; Alva Couch

Tuesday, November 27, 2012

Using HydroDesktop to Examine Precipitation and Discharge in Topeka, Kansas

A quintessential benefit of using HIS is the ability to access time series data from multiple sources. HydroDesktop provides tools to discover, download, and examine data from any data source registered in CUAHSI HIS. And, what you will see in the following exercise, is that HydroDesktop can be used to examine multiple variables from multiple sources to enable a better understand of a site or watershed. In this example, we will look at precipitation and discharge near Topeka, Kansas from 1990 to 2010.

Note: The screenshots included in this post are from HydroDesktop 1.5.10. Since this is an ongoing development project, the interface and functionality of the client are subject to change.

The first step we must take, is to limit our search by geography. To do this, lets first look at the state of Kansas as a whole. Select the state of Kansas either by using the Select by Attribute Tool on the Search Ribbon or highlighting the states layer in the Legend and, using the Select Tool (located on both the Map and Search ribbons), clicking on the state of Kansas.

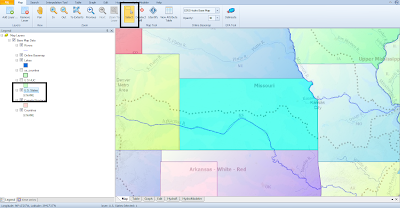
When selecting a feature in HydroDesktop, the corresponding layer must be highlighted in the Legend.

Next, we can limit the search for specific variables during a specific time period. This can be done under the Search Ribbon. There are three ways to search for multiple keywords. The first is to type the keywords into the upper search box separated by semicolons. You should use this only if you know the exact search terms, otherwise you may not get any search results. The second way is to begin typing the bottom search box, which uses autofill, to identify keywords then entering them into the upper search box (pressing enter will add a term to the upper search box). Lastly, you can add keywords by opening up the hierarchy of keywords under the Add More Keywords button. In this example, we will be searching for "Precipitation; Discharge, stream"

To define the search temporally, simply add start and end dates in the applicable boxes to the right of the keyword search boxes. In this example we will search from the 1/1/1990 to 1/1/2010.

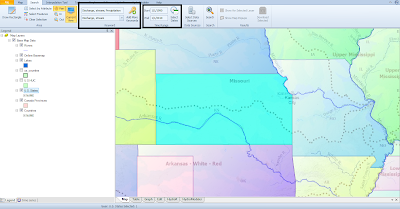
The keyword date search boxes are located next to each other on the Search Tab

Once you have entered the search criteria, click the Search Button. The search will take a few moments as HydroDesktop searches the metadata catalog for sites that match our search criteria.


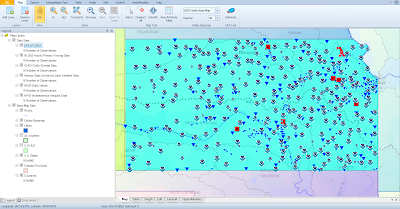
There are sites throughout the state of Kansas with observed precipitation and discharge values.

The search result yields a plethora of sites in the state from a number of data sources including the USGS, EPA, Kansas State University, and is a bit overwhelming to look at. Let's take a closer look at Shawnee County, where Topeka is located. To do this, open the Select by Attribute tool, select the US Counties layer, and type "Shawnee, Kansas" (autofill will complete your entry as it is typed).

You can use any GIS layer, like the U.S. counties layer that is included with the HydroDesktop download, to search for data.

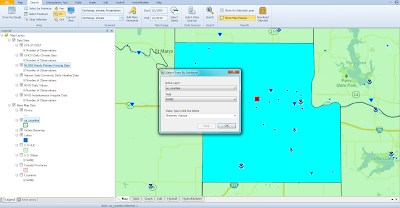
When we zoom into Shawnee County, we can see the search results are much more manageable and we can distinguish between sites that have precipitation observations and those that have discharge observations. To identify the stations with data I want to download, I have zoomed in further on Topeka (see screenshot below), turned the counties layer off, and turned the Google basemap on. After surveying the available sites, I've decided to examine sites in North Topeka. One has precipitation data from Kansas State University Daily Weather Data while the other has discharge data from the USGS NWIS Daily Values.


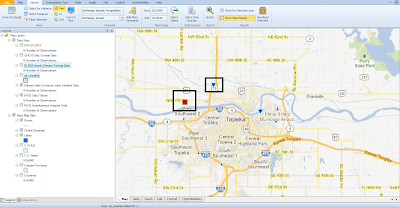
I decided to download data from two sites in North Topeka.

Finally, I can download the data from these sites by selecting them and clicking the Download button or hovering over them with Map Popups enabled (on the Search Ribbon) and clicking Download Data. With the download complete, I can examine the data in the Graph Ribbon.


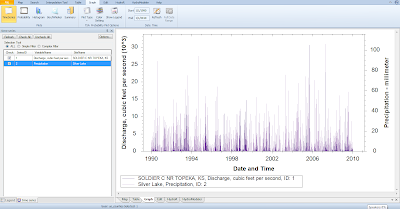
This graph shows precipitation and discharge data observed in North Topeka, Kansas from 1990 to 2010.

The data can also be exported using the Export button on the Table Ribbon.

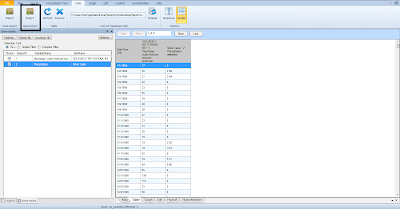
The option to export data is available on the Table Ribbon.


Wednesday, November 21, 2012

An Introduction to WaterOneFlow Web Services


A cornerstone of the CUAHSI HIS is a family of unique web services that enable data transmission. Web services are computer applications that interact, and exchange information, with other computers over the internet. The family of web services that has been developed for and employed by HIS is called WaterOneFlow (WOF).

WOF uses a set of functions to query to retrieve information from a HydroServer and the data is returned in a specific type of XML, WaterML, which has been specifically designed to transmit water data across the internet. The functions used are as follows:

Get Sites: Returns sites in a data source including location
Get Site Info: Returns information about any time series located at a specific site such as variables measured, start & end dates of observations, and units.
Get Variable Info: Returns information about a specific times series such as units, value type, data type, and sample medium.
Get Values: Returns values of a specific time series.

An easy way to become acquainted with these web services is by using HydroExcel, which is one of the CUAHSI clients that has been developed for retrieving water data registered in HIS. HydroExcel is Microsoft Excel spreadsheet that  uses VBA macros and an object library called HydroObjects to communicate with and retrieve data from WaterOneFlow web services.

HydroExcel is especially useful if you know what data source you are interested in, but is not as useful if you are trying to search over multiple data sources. When first opening HydroExcel, you are presented with the list of registered data services in HIS Central. To look at data, and metadata, you must simply copy the WSDL Location from a respective service and paste this URL into the WSDL Location box at the top of the Data Source tab.

The Data Source tab of HydroExcel. Be sure to enable macros and to refresh the list of services from HIS Central when the file is first opened.

After pasting the URL for your data source, you can invoke the individual web services by clicking on the buttons on the data source sheet (i.e. Get Sites, Get Variables, etc.). Clicking these will bring you to other sheets in the file where additional functionality is available. 


Tuesday, November 20, 2012

What is a HydroServer?

The Hydrologic Information System is a federated data system, which means data are not hosted in one place on one server, but on many servers in many places all over the world. Such servers that host data in HIS are called HydroServers. To enable this type of system, a relational database schema, the Observations Data Model (ODM), and software stack (ODM Tools) have been developed for publishers to manage their data.


The hardware and software needed to configure a HydroServer for time series data is not all that demanding. The standard configuration uses Microsoft products: Server 2008 R2 Standard Edition, SQL Server 2008 Standard Edition, and Microsoft Internet Information Services. Additionally, to enable the geospatial component of a HydroServer, a GIS server such as ArcGIS Server or GeoServer must be installed. 

With all of these components installed, it is then possible to load data into an ODM database, attach the database to SQL server, and finally setup a web service that can transmit data. 

Wednesday, November 14, 2012

The Observations Data Model

A diagram of the Observations Data Model schema.
Much of the data in HIS is stored in the Observations Data Model (ODM), which is a relational database schema that has been designed specifically for storing and retrieving water data. This schema, which can be seen above, is star-shaped with a table for DataValues at the center. In addition to storing data values, this table also holds a number of keys that provide connections to other tables in the schema such as the Sites and Variables tables.

Unique tools have been developed to load and interact with data stored in an ODM database. These include the ODM Data Loader, ODM Streaming Data Loader, and ODM Tools. These applications enable data publishers to load data into an ODM database in addition to providing the abilities to visualize, query, and edit data in the database.

In addition to querying and exporting data...
...ODM Tools can be used to visualize data stored in an ODM database.

For a more detailed look at the Observations Data Model, see this article in Water Resources Research:

Horsburgh, J. S., D. G. Tarboton, D. R. Maidment and I. Zaslavsky, (2008), A Relational Model for Environmental and Water Resources Data, Water Resources Research, 44: W05406, doi:10.1029/2007WR006392.

Friday, November 9, 2012

Searching for Data in HydroDesktop


HydroDesktop is a GIS-enabled, open source client that can be used to search for, download, analyze, and export data registered in HIS. In HydroDesktop, there are multiple ways to search for data, which are outlined below.

Note: The screenshots included in this post are from HydroDesktop 1.5.9. Since this is an ongoing development project, the interface and functionality of the client are subject to change.

1. Search by Rectangle - Using the search rectangle is the most basic way to spatially limit a search. Simply zoom to your area of interest using the zoom and pan tools on the map ribbon. Next, activate the Search Ribbon and click Draw Rectangle. Lastly, type a keyword, adjust the search dates, and click the Search button.

One way to search for data in HydroDesktop is by drawing a rectangle to limit your search spatially.

2. Search by Preloaded Shapefile - When opening HydroDesktop, one of the default projects includes the states and counties (or provinces) of North America in addition to Hydrologic Unit Codes (HUC's) in the United States. To search by one of these polygons, either select one using the Select Features tool (Note: To select a feature in a layer, that respective layer must selected in the Legend) or activate the Search by Attribute tool. Both of these are located on the Search Ribbon. If you select a feature with Select Tool, you are ready to enter your keyword, dates, and search away! If you use the select by attribute tool, however, you will have to define the attribute first in the dialogue screen.

In this example, I've used the select by attributes tool to select the state of New Hampshire.


3. Search by Other Layer- It is quick and easy to import your own shapefile into HydroDesktop. To do this, click the Add Layer button on the Map Ribbon. Search for and select your layer to import, then follow the same steps as previously outlined when using the preloaded political units or HUC's.

This example shows the result of searching for data via selection of a geologic layer in the Boston area.

4. Search by Delineated Watershed - The Delineate Watershed tool is a fantastic resource in HydroDesktop. Located on the Map Ribbon, this tool allows you to delineate a watershed simply by clicking on a place on the map. The tool uses EPA web services in order to create this polygon that will be found in your legend. Once it appears, simply select the watershed polygon, type in your keyword and dates, and click Search!

Using the Delineate Watershed Tool on the Charles River Basin, I was able to find 7 different sources of data within the Charles River watershed.


Thursday, November 8, 2012

Spotlight On: The Shale Network Project

Can natural gas extraction through hydraulic fracturing (also known as "fracking") and clean water coexist? This question has been subject of debate between concerned environmentalists and those who see this fracking as a promising step toward a transition away from other energy sources such as coal. Although natural gas is viewed by many as a positive alternative to coal because of costs as well as environmental impacts, questions regarding the environmental impacts of fracking still exist.

According to the EIA, natural gas generated electricity has grown dramatically over the past  two decades while production of coal and petroleum generated electricity has decreased.
One of the most active research projects currently utilizing HIS, the Shale Network, is investigating the impacts of natural gas extraction by generating knowledge about water quality and flow data in a place that has been characterized as one of the most promising sources of natural gas in the U.S., the Marcellus Shale region. The Shale Network is composed of researchers from Penn State, Pitt, Dickinson, in addition to representatives from other universities and organizations. Funded by the National Science Foundation, this project is building and maintaining a database that will, according to this NSF article, "be used to establish background concentrations of chemicals in streams and rivers, and ultimately to assess changes throughout the Marcellus Shale area."

This database, which is an aggregation of data sets from different organizations, is hosted by CUAHSI.

Data collected from Shale Network sites can be accessed in HydroDesktop

And, like other sources of data registered in HIS, data from the Shale Network project are publicly available and can be discovered using HIS clients.

Click here for more information about the Shale Network.


Monday, November 5, 2012

A One Stop Shop for Water Data

The CUAHSI HIS is a unique sources for water data because it enables access to multiple data sources seamlessly through one portal. While many government agencies such as the USGS and EPA make water data available, prior to the development of HIS, these data were only available independent of one another and most often in different formats. The technology developed and implemented in the HIS enables a user to search across such independent government agency data sources, in addition to data sources from academic research community, at the same time.

Image Credit: Michael Piasecki

Since 2008, the number of data sources available to the public in the HIS has consistently grown. In 2008, there were only 28 sources of water data available in HIS. Today, there are 100 sources of data registered in HIS that are available publicly!


What are those data sources, you say? As you might imagine, they vary in scale, scope, and organization type (among other things!). Some examples of data sources are the aforementioned government agencies (USGS NWISEPA STORET),  non-profit citizen led groups like the Ipswich River Watershed Association, and academic researchers such as those involved in the Shale Network.

To find out exactly what sources are providing data, you can visit the HIS Central website. Here you can find metadata about each and every source of data available in HIS such as a description, contact information for the publishing organization  statistics, geographic coverage, and suggested citation for the data. Below you can see a screenshot of the page for the Ipswich River Watershed Association's RiverWatch program.


Friday, November 2, 2012

How Can I Find and Download Water Data?

The CUAHSI community has developed tools to discover and access data registered in the CUAHSI HIS Central Catalog. The two most commonly used clients are HydroDesktop and HydroExcel.


HydroDesktop is an open-source, GIS enabled, desktop application. It provides several capabilities including data query, map-based visualization, data download, graphing, and data export. The primary purpose for HydroDesktop is discovering and retrieving observational data from the HIS system and it is designed to be useful for a number of different groups of users with a wide variety of needs and skill levels including: university faculty, graduate and undergraduate students, K-12 students, engineering and scientific consultants, and others. HydroDesktop is an open source project; if you are interested in development of the software, visit the HydroDesktop Codeplex page!


HydroExcel is a macro-enabled Microsoft Excel spreadsheet. The spreadsheet uses VBA macros and an object library called HydroObjects to communicate with and retrieve data from WaterOneFlow web services inside of Excel.

If you are a developer, be advised: You too can develop your own client that accesses data in the CUAHSI HIS as long as such a client can communicate with WaterOneFlow services!

The CUAHSI Hydrologic Information System

The CUAHSI Hydrologic Information System (HIS) is an internet-based system for sharing hydrologic time series data. It is comprised of databases and servers, connected through web services, to client applications, allowing for the publication, discovery and access of water data.


There are three types of computers that store and process data in the CUAHSI HIS:

HIS Central: This is the Central Catalog. It contains copies of metadata which facilitates searches. It operates similarly to a search engine, in that it harvests metadata from the data servers and allows it to be efficiently searched by the clients.

HydroServer: stores, organizes and publishes data; allows metadata to be harvested by HIS Central and data to be shared with clients.

Client: Software that gives users a convenient interface to access data. The first major role of the software clients is to enable data discovery by exposing metadata. For users wanting to find data, this is important as it allows a user to understand the data, and its source, before actually downloading the data. The second important role of the clients is to enable actual data download from HydroServers.
Different clients have different capabilities for analyzing data. For example, HydroDesktop is a GIS-enabled application with extensions that enable statistical analysis and modeling. HydroExcel is a Microsoft Excel spreadsheet with built in VBA macros that can access data registered with HIS Central, but has only minimal analysis tools such as creating a graph of data downloaded.


These three points of the HIS Triangle are tied together by web services, which are applications that facilitate the exchange of information over the internet. More on these soon.

For more information, visit the HIS website!