
Working with HydroDesktop Databases
The Table Tab
The Graph Tab
Importing Time Series Data
Exporting Time Series Data
The Edit Tab
HydroDesktop Databases
Temporal data are stored in a relational database called the Data Repository. Catalogs of available data, which may not yet have been downloaded into the Data Repository, are maintained in another database called the Metadata Cache database.
Tools in HydroDesktop know how to read these databases and present information from them to the user, and they also know how to properly save information to these databases. Therefore, it’s generally a good idea to use HydroDesktop to work with these databases. However, some users may want to open the databases directly. This page describes how to locate and open HydroDesktop databases outside of HydroDesktop.
Locating the HydroDesktop Databases
The Data Repository and Metadata Cache databases are linked to the current project opened in HydroDesktop. To locate the Data Repository database:
In the Ribbon, in the Table tab, in the Database panel, click Change. The location of the current database is shown in the dialog that opens.
The Metadata Cache database has the name ending with _cache.sqlite. To locate the Metadata cache database:
In the Ribbon, in the Table tab, in the Database panel, click Change. The location of the current metadata cache database is shown in the dialog that opens.
Viewing the HydroDesktop Databases
HydroDesktop attempts to provide simplified and useful views into its databases through its user interface. However, it is also possible to open and peruse the database contents directly. By default, HydroDesktop uses SQLite as its database format. You can view the contents of a SQLite database using the following free viewers:
SQLite Database Browser
Firefox SQLite Manager Add-on (requires Firefox)
The Table Tab
The Table Tab in HydroDesktop provides functions to view and export time series data. You can also change the current database and build your own local metadata cache using the tools on this tab.
 |
| The Table Tab |
The Graph View is a HydroDesktop extension that provides functionality for visualizing data that have been downloaded and stored in the HydroDesktop data repository database. The Graph View enables you to generate a variety of plot types for time series data as well as simple summary statistics that can be used for exploratory data analysis. A variety of plot customization options are available for changing the look and feel of the plots generated by the Graph View extension.

Visualizing Data in the Graph View
Once you have discovered and downloaded some time series data into HydroDesktop, you can use the following steps to begin visualizing those data using the Graph View extension:
1. Make sure the Graph View is active by clicking on the “Graph” tab at the top of the HydroDesktop window.
2. Select a data series by clicking on the check box to the left of any of the data series in the HydroDesktop Series Selection Tool. You will notice that the Graph View creates a plot of the selected series.

3. You can visualize multiple series at once by selecting multiple series on the series selection tool. You will notice that a legend appears at the bottom of the plot when more than one series is selected.

Zooming In and Out On Plots
You can easily zoom in and out on a plot within Graph View using the following steps:
1. Create a time series plot by selecting one or more data series in the Series Selection Tool.

2. Click and drag a rectangle on the plot to define a zoom area. You will notice that when you hover over the plot the cursor changes to a cross, enabling you to select a zoom area.

3. While you are zoomed in, you will notice that scroll bars appear at the bottom and on the right of the plot window. You can zoom in on a time series plot and then scroll through time using the scroll bars.
4. To zoom out, you can right click on the plot and select “Un-zoom,” “Undo All Zoom/Pan,” or “Set Scale to Default.”

Changing the Plot Type and Displaying Summary Statistics
Graph View offers several different types of plots for visualizing your time series data. Use the following steps to change the plot type in Graph View:
Select one or more data series to be plotted in the Series Selection Tool.
On the Graph View ribbon, select the type of plot to be displayed by clicking on the appropriate icon. Available plot types are shown below:
2a. Time series

2b. Probability

2c. Histogram

2d. Box/whisker


To display summary statistics for one or more selected time series, click on the “Summary” icon on the Graph View ribbon. Summary statistics for the currently selected time series will be displayed.

Graph Options
Some of the plot types within the Graph View have some options for customizing the look and feel of the plot that is displayed. Use the following steps to explore the options for each plot type:
1. Select one or more time series from the Series Selection Tool to create a plot in the Graph View.
2. Select the desired plot type from the Graph View Ribbon at the top of the Graph View. You will notice that a set of options for the selected plot type appears in the Graph View ribbon.
3. Select options to customize the plot. The following describes the options available for each plot type:
- Time Series and Probability Plots - Using the “Plot Type” button you can set the plot type to show the line, the data points, or both. Using the “Color Setting” button you can set the colors used to symbolize the lines and points on the plots. Using the “Close Legend” button you can control whether the legend is shown on the plot or not.
- Histograms - Using the “Histogram Type” button you can control the type of histogram that is shown. Using the “Binning Algorithms” button you can choose the algorithm used to calculate the histogram bins.
- Box/Whisker Plots - Using the “Box Whisker Type” button you can choose the time scale for the box/whisker plots (e.g., monthly, seasonal, yearly, or overall).
Setting the Date Range
You can restrict the date range of the data shown in the Graph View plot using the following steps. The plot is drawn for the selected date range, and the summary statistics are calculated only for data that fall within the selected range.
1. Select one or more time series from the Series Selection Tool to create a plot in the Graph View. You will notice that the start date and end date for the selected time series are shown in the Graph View ribbon.
2. Change the start date and the end date for the plot in the graph view ribbon. When you have selected an appropriate date range, click the “Refresh” button.

You will notice that the plot has been restricted to the selected date range.
You can easily reset the plot to the full date range by clicking the “Full Date Range” option on the Graph View ribbon.
Exporting the Plot Image
Use the following steps to export the plot image that is shown in the Graph View:
1. Create a plot that you want to export by selecting a number of data series from the Series Selection Tool and the desired plot type from the Graph View Ribbon.
2. To copy the plot image to the clipboard, right click on the plot window and select “Copy” from the context menu. The image can then be pasted into a document or other software program
3. To save a copy of the image to disk, right click on the plot window and select “Save Image As.” A file dialog will open asking you where you want to store the image. Select a location to which you want to save the image, select a desired file type, give your image file a name, and then click the “Save” button to save it to disk.

4. The image that you export will look something like the following (depending on the data series that you have selected).

Time Series Data Import
HydroDesktop can import time series data from delimited text files and from Microsoft Excel files. This is useful when some of the data for your analysis is not available online and when you want to use HydroDesktop to compare the online downloaded data with your own data.
How To Import Data
Time series can be imported using the data import tool. In addition, users familiar with SQLite can modify the time series database directly. The database is located in the same directory where you saved your project.
Importing using the Data Import Tool
On the Table tab of the ribbon, click the Import button to invoke the data import dialog. In the first step, select the file to import. The file must be an Excel, CSV, WaterML or text file with at least two columns: Time and Value. The file can contain a single time series (one variable at one site) or multiple time series (several variables and / or several sites).
Format Options
For correct data import of text files, it is necessary to set up the format options. Typically the text files use the delimited format options with one of the following separators: Comma, Tab, Space, Pipe or Semicolon.
Properties of Imported Fields
The imported file must contain one Date/Time column. The system will try to select this column automatically. For all other columns that you wish to import, the properties must be specified. These properties are: Site, Variable, Source, Method, Quality Control and Offset. The Site and Variable properties are required. If your current Hydrodesktop project already contains data, you may select an existing site or an existing variable. Otherwise, use the Create new... button to specify a new site.
 |
| Time Series Import Dialogue |
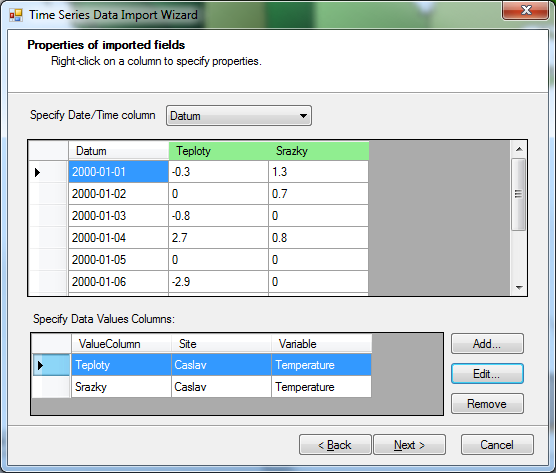 |
| Time Series Properties of Imported Columns |
Time Series Data Export
HydroDesktop can export your time series data to delimited text files for use in other programs. This is useful when HydroDesktop does not include all of the analysis capabilities needed, or when the user prefers to work with downloaded data in another program.
How To Export Data
Time series can be exported using a number of workflows. In addition, users familiar with SQLite can access the time series database directly. The database is typically located in the same directory where you saved your project.
Exporting using the Data Export Tool
On the Table tab of the ribbon, click the Export button to invoke the data export dialog.
Exporting from the Series Selector
In views such as table view or graph view, a series selector shows a list of time series on the left side of the display. To export a time series, right-click the time series in the series selector and click Export Series.
Exporting from the Map Legend
In views such as map view, a legend shows a list of map layers on the left side of the display. If a data search or download has been performed, a group layer called Data Sites will be included in the legend, with each layer in this group symbolized by data source. Layers with downloaded data will include a box drawn around the site symbol.
To export downloaded data for a given data source, right-click the layer name for that data source, point to Data, and click Export Time Series Data.
Export Options
When exporting time series data, a dialog like the one below provides options for the data export.
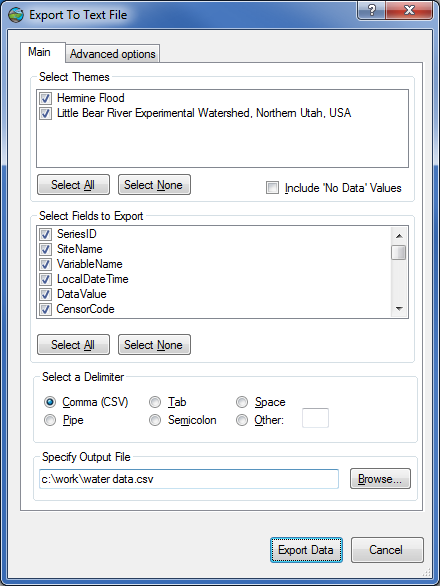 |
| Time Series Export Dialog |
This dialog allows the user to set the following options:
- Which themes will be included
- Whether or not ‘No Data’ values will be included.
- Which fields will be included to describe each time series value
- Which delimiter will be used to separate field values
- Output file name and location
Note: When exporting individual time series using the series selector, not all export options may be available.
After clicking Export Data in the dialog, the time series data are exported to a text file. You can close the dialog once the export is complete.
The Edit Tab
The Edit View is a HydroDesktop extension that provides functionality for editing time series data that have been downloaded and stored in the HydroDesktop data repository database. The Edit View enables you to perform a number of data editing functions that can be very useful in doing simple data quality assurance and quality control as well as in preparing time series data that may have some anomalous data values for input to an analysis or model.
Selecting Data Series to Edit
Edit View was designed to enable editing of one data series at a time. Use the following steps to select a data series for editing:
1. Select a data series in the HydroDesktop Series Selection tool by clicking the check box next to it. This will create a plot of the data series in the plot portion of the Edit View tab.

2. Once a series is selected, click the “Edit Series” button on the Edit View ribbon. You will notice that the plot changes and shows the points associated with the selected series. The data values of the series are also loaded into the tabular view at the bottom of the Edit View tab, and the data filters at the right of the plot are enabled. The series you have selected is now ready for editing.

Selecting Data Values to Edit
Before data values within a data series can be edited, they must first be selected. You can select individual data values by clicking on their associated record in the tabular view at the bottom of the Edit View tab. When you do so, you will notice that the corresponding point on the plot changes color from black to red. Additionally, the Edit View extension provides several filters that can be used for selecting multiple data values that you would like to edit. These include the following:
- Value Threshold Filter - use this filter to select all data values greater than or less than a given threshold or between two threshold values. Useful for selecting out of range values for interpolation.
- Data Gaps Filter - use this filter to select data values where the time gap between two values is greater than a threshold. Useful for finding data gaps.
- Date Filter - use this filter to select all data values greater than or less than a given date or between two dates. Useful for selecting blocks of data for deletion.
- Value Change Threshold Filter - use this filter to select all data values where the change from one value to the next is greater than some threshold value. Useful for detecting anomalies in time series.
The following is an example of how to apply a value threshold data filter:
1. If you have not already, select a data series for editing and click the “Start Editing” button on the Edit View ribbon.
2. Type a value into one of the threshold value boxes and then click the “Apply Filter” button. In the example below, a filter has been applied to select dissolved oxygen data values greater than 15 mg/L, which are obvious out of range values that need to be edited.

Changing the Value of Selected Data Values
The Edit View extension provides functions for changing the value of selected data values. An example of when this functionality could be useful might be when an improper offset has been used in a datalogger program and the values of a data series need to be adjusted. Use the following steps to change the value of selected data values:
1. If you have not already, select a data series for editing and click the “Start Editing” button on the Edit View ribbon.
2. Use the data filters or click on records in the Edit View table to select the data values that you would like to modify.
3. Click the “Change Value” button on the Edit View ribbon. The following window will open:

4. Select the operation that you would like to perform to the selected data values (e.g., add, subtract, multiply, or set value to).
5. Type a numeric value into the text box and then click OK. In the following example, the Edit View extension will add a value of 20 to the selected data values.

Interpolating Selected Data Values
The Edit View extension provides a function for linearly interpolating data values based on the numeric values of the data values that come before and after the selected data values in time. This can be useful for correcting anomalies and obvious out of range values within a dataset. Use the following steps to interpolate selected data values:
1. If you have not already, select a data series for editing and click the “Start Editing” button on the Edit View ribbon.
2. Use the data filters or click on records in the Edit View table to select the data values that you would like to modify. In the following example, all dissolved oxygen data values greater than 15 mg/L have been selected using a value threshold filter as it is known that these are obvious out of range data values that need to be corrected.

3. Click the “Interpolate” button on the Edit View tab. A window will pop up asking you if you are sure that you want to Interpolate. Click the “Yes” button. After a moment you will notice that the data values you selected have now been linearly interpolated and that the scale of your plot has been changed to reflect the new extents of your data.

Flagging Selected Data Values with Qualifiers
When you edit data values within a data series, you may want to flag them with a qualifying comment that states that the data values have been edited. Use the following steps to flag selected data values with a qualifying comment:
1. If you have not already, select a data series for editing and click the “Start Editing” button on the Edit View ribbon.
2. Use the data filters or click on records in the Edit View table to select the data values that you would like to add a qualifying comment to.
3. Click on the “Flag” button on the Edit View ribbon. The following window will open.

4. On this form you can either select a data qualifying comment from the drop down list at the top of the form (in the case that it already exists in the HydroDesktop database), or you can create a new qualifying comment by selecting “New Qualifier” from the drop down list.
5. If you selected “New Qualifier,” you need to create a code for your qualifier and a description, which is the text of your qualifying comment.
6. Once you have completed the form by either selecting an existing comment or creating a new one, click the “Set” button to apply the qualifying comment to the selected data values.
Inserting Data Values
In some cases, you may want to insert one or more data values into an existing data series. This functionality is useful in filling small data gaps with missing values. Use the following steps to insert data values into an existing data series:
1. If you have not already, select a data series for editing and click the “Start Editing” button on the Edit View ribbon.
2. Click the “Add Point” on the Edit View ribbon. The following window will open.

3. On the third row of the table on this form you can type in the data value that you wish to add and the additional metadata that describe it. The minimum required fields are DataValue, LocalDateTime, UTCOffset, and DateTimeUTC, which are all highlighted in yellow.

4. You can continue adding new values in the final row in the table until your edits are complete. When you have finished inserting new data values, click the “Add” button to add the new data to your data series.
Deleting Data Values
In many cases you will need to delete erroneous data from data series that you are working with. This can be useful for example when you have a sensor data stream within which the sensor has failed and you need to delete the period of data during which the sensor failure occurred. Use the following steps to delete values from a data series:
1. If you have not already, select a data series for editing and click the “Start Editing” button on the Edit View ribbon.
2. Use the data filters or click on records in the Edit View table to select the data values that you would like to modify. In the following example, all dissolved oxygen data during a period of sensor failure have been selected for deletion using the date filter.

3. Click the “Delete Point” button on the Edit View ribbon. The following window will appear. Click the “OK” button to delete the selected data values.

You will notice that the selected data values have been deleted from the data series.

Restoring Data Series Values
During your editing session, the Edit View extension maintains a copy of the data in memory. Any editing functions that you perform are made on the memory copy of the data. The changes that you make to the data will not be saved to the database until you decide to do so. If you make a mistake and would like to undo your edits, you can click the “Restore Data” button on the Edit View ribbon. This button will reload the original data series from the HydroDesktop database and will discard any changes that you have made since your last save.
Saving Data Series Edits to the HydroDesktop Database
To save the edits you have made to a selected data series to the HydroDesktop database, click the “Save to Database” button on the Edit View ribbon. Any changes that you have made to the data series will be saved to the database, overwriting the original data series.