A quintessential benefit of using HIS is the ability to
access time series data from multiple sources. HydroDesktop provides tools to discover, download, and examine data from any data source registered in CUAHSI HIS. And, what you will see in the following exercise, is that HydroDesktop can be used to examine multiple variables from multiple sources to enable a better understand of a site or watershed. In this example, we will look at precipitation and discharge near Topeka, Kansas from 1990 to 2010.
Note: The screenshots included in this post are from HydroDesktop 1.5.10. Since this is
an ongoing development project, the interface and functionality of the client are subject to change.
The first step we must take, is to limit our search by geography. To do this, lets first look at the state of Kansas as a whole. Select the state of Kansas either by using the
Select by Attribute Tool on the
Search Ribbon or highlighting the states layer in the
Legend and, using the
Select Tool (located on both the
Map and
Search ribbons), clicking on the state of Kansas.
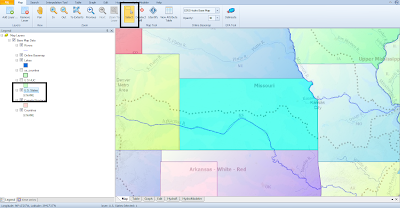 |
| When selecting a feature in HydroDesktop, the corresponding layer must be highlighted in the Legend. |
Next, we can limit the search for specific variables during a specific time period. This can be done under the
Search Ribbon. There are three ways to search for multiple keywords. The first is to type the keywords into the upper search box separated by semicolons. You should use this only if you know the exact search terms, otherwise you may not get any search results. The second way is to begin typing the bottom search box, which uses autofill, to identify keywords then entering them into the upper search box (pressing enter will add a term to the upper search box). Lastly, you can add keywords by opening up the hierarchy of keywords under the
Add More Keywords button. In this example, we will be searching for "Precipitation; Discharge, stream"
To define the search temporally, simply add start and end dates in the applicable boxes to the right of the keyword search boxes. In this example we will search from the 1/1/1990 to 1/1/2010.
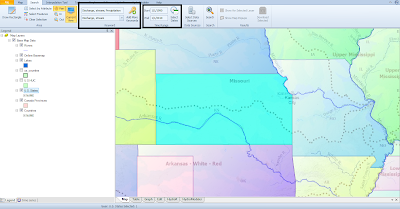 |
| The keyword date search boxes are located next to each other on the Search Tab. |
Once you have entered the search criteria, click the Search Button. The search will take a few moments as HydroDesktop searches the
metadata catalog for sites that match our search criteria.
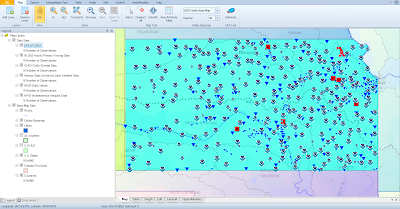 |
| There are sites throughout the state of Kansas with observed precipitation and discharge values. |
The search result yields a plethora of sites in the state from a number of data sources including the USGS, EPA, Kansas State University, and is a bit overwhelming to look at. Let's take a closer look at Shawnee County, where Topeka is located. To do this, open the Select by Attribute tool, select the US Counties layer, and type "Shawnee, Kansas" (autofill will complete your entry as it is typed).
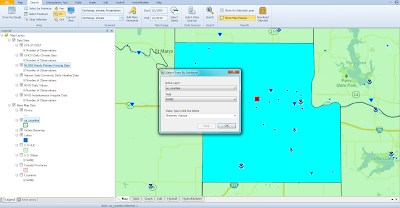 |
| You can use any GIS layer, like the U.S. counties layer that is included with the HydroDesktop download, to search for data. |
When we zoom into Shawnee County, we can see the search results are much more manageable and we can distinguish between sites that have precipitation observations and those that have discharge observations. To identify the stations with data I want to download, I have zoomed in further on Topeka (see screenshot below), turned the counties layer off, and turned the Google basemap on. After surveying the available sites, I've decided to examine sites in North Topeka. One has precipitation data from
Kansas State University Daily Weather Data while the other has discharge data from the
USGS NWIS Daily Values.
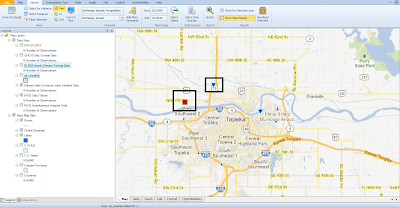 |
| I decided to download data from two sites in North Topeka. |
Finally, I can download the data from these sites by selecting them and clicking the
Download button or hovering over them with
Map Popups enabled (on the
Search Ribbon) and clicking
Download Data. With the download complete, I can examine the data in the
Graph Ribbon.
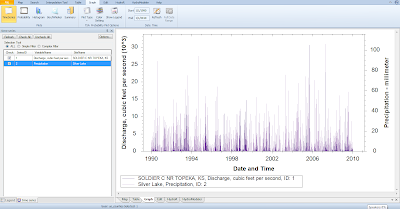 |
| This graph shows precipitation and discharge data observed in North Topeka, Kansas from 1990 to 2010. |
The data can also be exported using the
Export button on the
Table Ribbon.
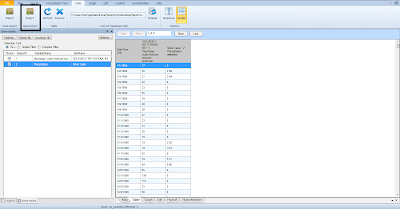 |
| The option to export data is available on the Table Ribbon. |


